Validation / 2 of 10
Bar under end pressure
The axial bar again, now compressed by a uniform pressure on its end face. Pressure pushes along the inward normal, so a positive pressure must shorten the bar. The example checks the sign of pressure loads and that a pressure is treated as a force per area, not as a total force.
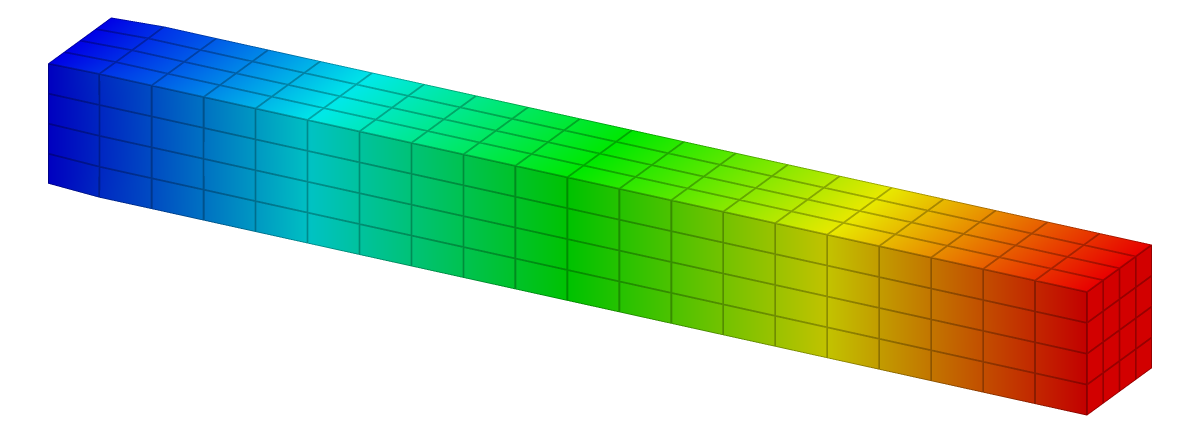
| Reference | KoFEM | Difference |
|---|---|---|
| −4.7619 × 10⁻³ mm | −4.7358 × 10⁻³ mm | −0.55 % within ±2 % |
The problem
| 1000 mm | |
| 100 × 100 mm | |
| 210 GPa | |
| 0.3 | |
| 1 MPa |
| Supports | x = 0 face fixed (Ux, Uy, Uz). |
|---|---|
| Load | Pressure p on the x = L face. |
| Measured | Mean x-displacement of the x = L face. |
Analytical solution
On the end face the outward normal is , so the traction is . The bar carries an axial force and a uniform compressive stress . Following the axial bar derivation,
The cross-section cancels: an end pressure shortens a bar by the same amount whatever its size. With , the tip moves by .
Finite element model
| Mesh | 20 × 4 × 4 grid: 320 linear 8-node hexahedra (P1) |
|---|---|
| Unknowns | 525 nodes, 1,575 degrees of freedom |
| Material | Linear elastic, isotropic |
| Solver | KoFEM engine (MFEM), the WebAssembly build the app runs: engine-5ceb743373dd |
The pressure is integrated over the end face with the same boundary integrator as the axial bar's force, with the traction built from each face's normal.
Results
| Quantity | tip displacement u |
|---|---|
| Reference | u = −p·L / E = −4.7619 × 10⁻³ mm |
| KoFEM | −4.7358 × 10⁻³ mm |
| Difference | −0.55 % within ±2 % |
Discussion
The difference, −0.55 %, matches the axial bar in tension (−0.55 %). That is what linearity predicts: the resultant here is instead of , and every displacement scales with the load. An identical relative difference shows that the pressure path builds the same load vector as the force path with , so both its sign and its area scaling are right.
The two ways this could go wrong are easy to spot. A flipped sign would stretch the bar instead (about −200 %). Treating as a total force instead of a force per area would be off by a factor of .
Reproduce
In the app: open the model, then Studies → Static 1 → Run static solve, select the result plot and set Field to Ux. The Result summary shows Min Ux -4.736e-3 mm.
From a clone (Node.js 20+, bash, curl), this solves the model with the same engine and prints its line:
git clone https://github.com/mkofler96/KoFEM.git && cd KoFEM
bash scripts/fetch-wasm-engine.sh
node examples/validation/run.mjs --case surface-pressure
Case Quantity FE Reference Err% Tol% Status
Bar under end pressure tip displacement u -4.7358e-3 -4.7619e-3 -0.55 2 PASSReferences
- J. M. Gere and B. J. Goodno, Mechanics of Materials, Cengage Learning: axially loaded members, torsion, deflections of beams.
KoFEM is research software and is not certified for safety-critical design. It solves linear-static, linear-elastic problems. Check results that matter against your own references.